Guest Column: A Better Tactic for Hedge Fund Analysis
Analyzing the performance of hedge funds is a critical first step in manager sourcing and due diligence. Conceptually, this undertaking has two important objectives: First, to determine if the historical returns are attractive in the first place, and second, to establish parameters for expected returns on a forward-looking basis.
Evaluating the attractiveness of past returns is a relatively straightforward mechanical exercise. Either the returns have met the required cost of capital for the given allocation—perhaps generating alpha relative to indices and peers over time—or they have not. At the very least, managers who have not demonstrated an ability to generate the desired return profile in the past can reasonably be removed from the opportunity set. That is, acceptable performance should be a necessary but not solitary qualifier.
However, the predictive value of historical returns is admittedly limited. Most investment professionals are intimately familiar with the disclaimer: “Past performance is not indicative of future results.” Absent a hypothesis as to why similar returns could rationally be expected in the future, strong historical performance is almost irrelevant. Fortunately, research has shown there are a host of qualitative factors and characteristics that can measure the predictive validity of past returns—hence establishing some probabilities around persistence of performance.
Accepting that qualitative analysis is a critical part of due diligence, it is nevertheless important to pull maximum insight from the available performance data. A thorough analysis of historical returns can not only guide subjective lines of questioning, but also provide direct evidence as to the predictability of returns.
Many researchers look at periodic performance across various intervals—returns, alpha, standard deviation, etc. over one year, three years, or since inception. Such a static analysis, like a photograph, provides precise details and allows for effective and granular comparison to benchmarks and peers. Yet it fails to fully capture changes in these individual data points over time. An alternative would be to evaluate performance metrics on a rolling basis, such as graphically plotting rolling twelve-month returns since inception. Similar to a video, this shows returns evolving dynamically over time and historical ranges across best and worst performance periods.
A superior approach to performance evaluation would be a process that incorporates both types of methodologies over every possible period. In order to develop such a tool, we turn towards the options industry.
In a 1990 article titled “How to Tell if Options Are Cheap,” published in the Journal of Portfolio Management, Galen Burghardt and Morton Lane introduced volatility cones to solve a shortcoming of the Black-Scholes option pricing model. While the model is a powerful tool for estimating an option’s theoretical price, it assumes constant volatility. As any market participant over the last decade knows, this assumption simply doesn’t hold.
While mean-reverting over longer periods, at any given time the volatility of a specific security is likely to be either higher or lower than the long run average. Since options have different expiration schedules and volatility isn’t constant, it should stand to reason that a more accurate pricing mechanism would incorporate a dynamic volatility input.
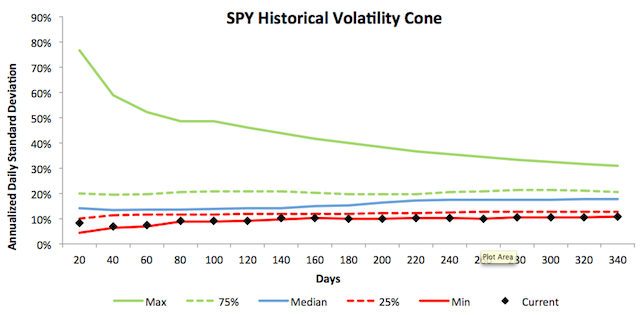
Burghardt and Lane developed volatility cones to visually represent the term structure and range of returns’ standard deviation over various periods of time, as well as show current volatility relative to historical ranges. As an example, the figure below displays the annualized standard deviation of daily returns for the S&P 500 (SPY) from 2009 until August 2014.
Figure 1: S&P 500 (SPY) Historical Volatility Cone (2009-2014)
Interpreting the graph is relatively straightforward: it plots the maximum and minimum values, 75th and 25th percentile ranges, and median and current levels of realized volatility over different values of n in the calculation of standard deviation. For instance, the range of standard deviation over 280 days is unsurprisingly much tighter than across a 60-day period. The graph also suggests a good long run “average” volatility might be 15%. More helpfully, the actual price volatility of SPY over both short and long term periods is currently very near to the lowest levels of the entire sample set. For options traders needing timely data to determine how cheap or expensive options contracts of various expiry schedules are, based on the implied volatility priced into them, such graphs quickly incorporate a great deal of information into a fairly intuitive format.
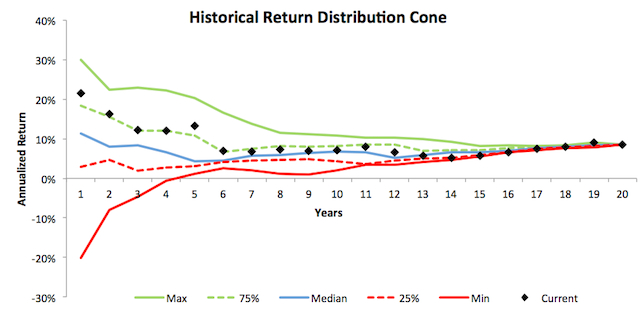
This same methodology can apply to hedge fund manager performance. Such an analysis graphically displays the rolling return over every available period (i.e. the current series), as well as the ranges of those periodic rolling averages. Using the returns of a hypothetical manager’s portfolio below (60% stock / 40% bond) with a track record from 2013 to 1994, we are able to chart figure 2.
Figure 2: Hypothetical Manager Historical Return Cone
A quick examination of the chart shows recent shorter-term performance has been very strong relative to long-term averages as well as typical one- and two-year rates of return since inception. Such an observation may provoke qualitative questions about attribution and market conditions favorable for the strategy.
Another key takeaway of the return cone is that short-term measures of performance—like standard deviation—can fluctuate far more widely than longer-term measures. While the hypothetical manager’s worst one-year rate of return was -20%, investors in this strategy over any rolling period greater than five years have always achieved positive compound returns. Hence, a comprehensive analysis of historical returns can be a useful tool in setting appropriate performance evaluation timeframes, as well as required return standards, for a given strategy.
This tool further allows the researchers to fully analyze the stability of returns simultaneously over every possible period, and persistent performance may be more attributable to skill than market conditions or mere luck. A highly stable return profile may also indicate a systematic and replicable investment process. Either indication could increase the predictive value of the past returns.
While there is no guarantee that future returns will look exactly like the past, a more complete understanding of the total distribution of historical returns can better prepare investors for future possibilities.
 Christopher M. Schelling is the deputy CIO and director of absolute return at Kentucky Retirement Systems as well as an adjunct professor of finance at the University of Kentucky.
Have a brilliant idea? CIO welcomes original contributions from asset owners. Send op-eds, research drafts, rants or raves to Managing Editor Leanna Orr at lorr@assetinternational.com.
